Tag: basic plot matlab

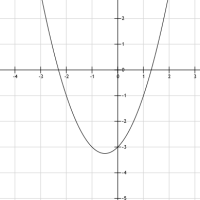
How to plot a function in Matlab
If you have chosen to use Matlab to plot a function today, and this happens to be the first time you want to do so, here area quick look at how you can instruct Matlab to plot your function. There are many online systems allowing you to plot function without having to go through “coding”,…

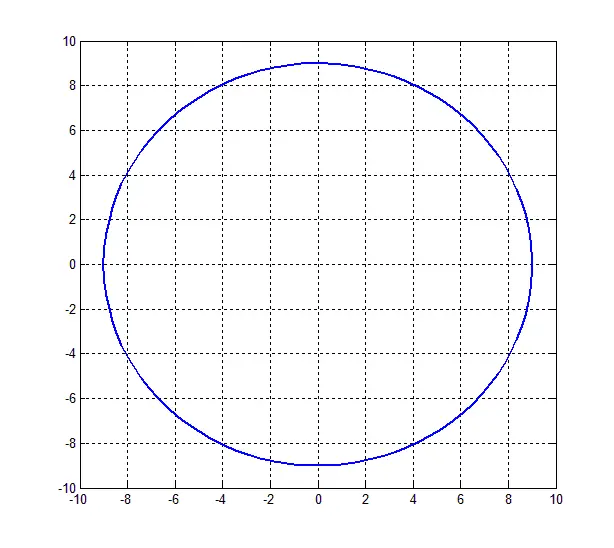
How to plot a circle in Matlab
Here is how to plot a circle in Matlab Plot the unity circle in Matlab Code Angles=(0,2*pi,100); plot(cos(angles), sin(angles)) Plot a circle in Matlab with a given radius Angles=(0,2*pi,100); plot(9*cos(angles), 9*sin(angles)) If you need MATLAB homework help from coding experts, you can visit this site.


