If you have chosen to use Matlab to plot a function today, and this happens to be the first time you want to do so, here area quick look at how you can instruct Matlab to plot your function.
There are many online systems allowing you to plot function without having to go through “coding”, like FooPlot.com which I used in the past.
But Matlab is one of the most powerful tools out there, easy to learn and sure to be a strong added value to your curriculum.
How to plot a function in Matlab
Example 1

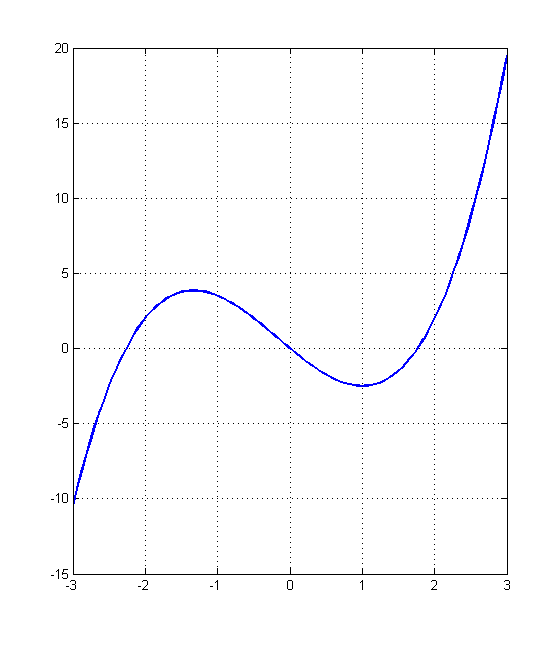
This is a function that depends on the variable x, and the task is to plot this function from x=-3 to x=3
Here is the code to be used. Learn more about plotting in Matbal
x=linspace(-3,3,100);
y=(x.^3+0.5*x.^2-4*x);
grid on;
plot(x,y,'linewidth',2)
Where linspace create a vector of 100 elements linearly spaced by the same value (3-(-3))/100
You can call this function help by typing help linspace or doc linspace in Matlab
The second line of the code above creates our function
The third displays the grid on the plot
The last actually does the plot with a linewidth of 2
Example 2
![]()
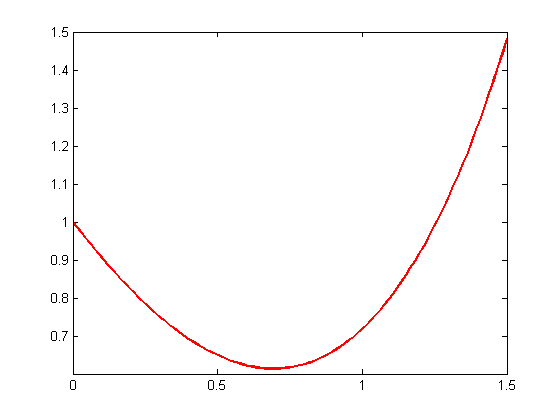
We would like to plot the function above from the interval 0 to 1.5
Using the same procedure as above we will get the following code
x=linspace(0,1.5,100);
y=exp(x)-2*x;
plot(x,y,'r','linewidth',2)
And the resulting plot will be the following.
(Use the line help plot to see how you can add titles to a plot, change colors and more)
Finding the value of a function at a given point without having to plot
Example

Using the equation above and writing as equivalent the following code
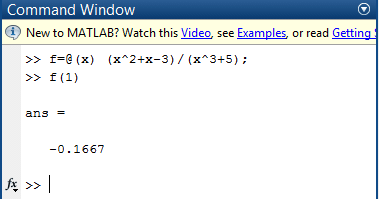
f=@(x) (x^2+x-3)/(x^3+5);
will allow you to have the value of this function as x changes
To find the value of f when x=1
simply write f(1) and hit the ENTER key.
It exists many ways to plot function in Matlab and it is OK to need to know more than a method, some methods are easier than some others considering the problem you are working on.


